
The OpenEEmeter Working Group Is Pleased to Release LF Energy OpenEEmeter 4.0
LF Energy OpenEEmeter measures the energy impacts of demand-side interventions in buildings. OpenEEmeter 4.0 provides enhanced performance of the daily model with dramatically reduced seasonal and weekend/weekday bias, along with increased computational efficiency.
- After months of collaboration, the LF Energy OpenEEmeter Working Group is releasing the open source OpenEEmeter 4.0 with major improvements to the daily model and a more user-friendly experience.
- OpenEEmeter 4.0:
- Reduces seasonal bias in the daily model by 84%
- Reduces weekend/weekday bias in the daily model by 95%
- Runs up to 100x faster with monthly data, and 2 – 10x faster with daily data
- Along with this release, the OpenEEmeter community is also publishing a detailed 4.0 model specification and results of thorough testing conducted across residential and commercial sectors and gas and electric fuels.
- LF Energy will host a public webinar on Tuesday, March 12, 10:30am PST to cover the methods and code advancements.
- The final model specification and testing results can be found on the OpenEEmeter website.
Advancing OpenEEmeter Methods
In 2016, a dedicated group of industry advisors and technical subject matter experts developed OpenEEmeter, a set of open source methods and tools to measure the energy impacts of demand side programs. Since then, OpenEEmeter has been used to measure hundreds of thousands of demand side projects implemented across nearly one hundred programs. Today, OpenEEmeter enables settlement for programs that deliver load impacts measured “at the meter.” In this way, OpenEEmeter has helped establish customer-facing programs as competitive energy resources.
However, since 2016 both demand side technologies and the field of machine learning have rapidly progressed, creating a need and opportunity to advance OpenEEmeter to facilitate the next generation of programs.
So we got the band back together. Supported by LF Energy and advised by experts who have graciously donated their time, Recurve led the development of OpenEEmeter 4.0. This version offers major improvements to the daily model and code, which is used when a building’s energy consumption is metered in daily intervals.
The 4.0 methods achieve three major improvements, explained below:
- Greatly reduced seasonal bias
- Greatly reduced weekday/weekend bias
- Huge computational efficiency improvements
Seasonal Bias
The OpenEEmeter 3.0 daily methods do not differentiate between seasons. This means a 60 degree day in November is treated the same as a 60 degree day in June. However, for many buildings, energy consumption patterns change depending on the season – in particular heating and cooling usage. Across populations of customers, these patterns can create systematic under- or over-estimates of consumption.
OpenEEmeter 4.0 solves this issue by enabling the model to split into seasons if doing so improves performance beyond a threshold “penalization” value. As a result, seasonal bias is reduced by 84% in the samples studied. The figure below compares the distributions of winter bias in a residential gas sample of 4,000 meters. The 3.0 results are shown in the top panel and the 4.0 results are in the bottom panel.
The large red bulk of the top distribution results from the model systematically underpredicting gas consumption on winter days, where space heating is often initiated at warmer average daily temperatures than other times of year and people are prone to using more hot water. The much narrower distribution in the bottom panel shows that this problem is almost entirely eliminated in the 4.0 model.
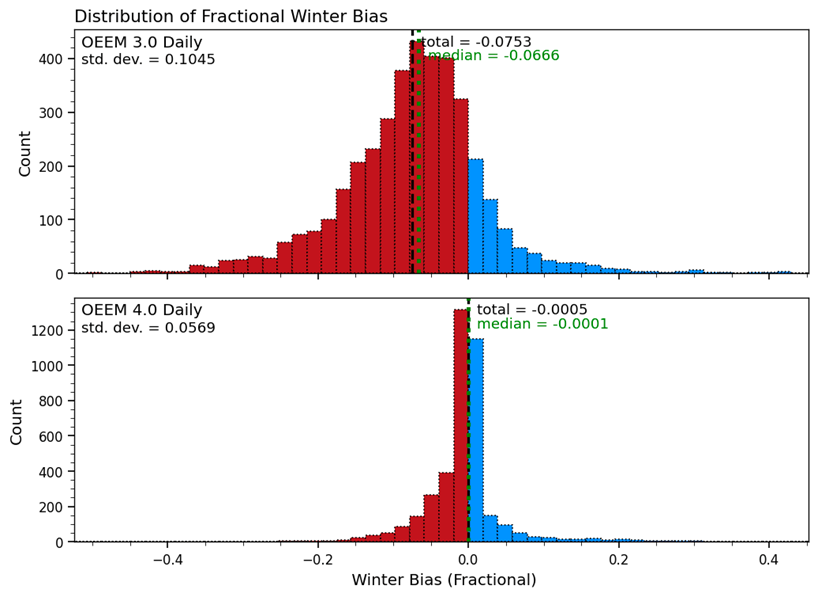
Figure: The distribution of winter bias in a sample of residential gas meters measured using OpenEEmeter 3.0 daily model (top) and the 4.0 daily model (bottom). Winter bias improves from -16.7 Therms/meter (7.5%) to -0.1 Therms/meter (0.05%) in the 4.0 version.
To understand the improvement in 4.0 it helps to look at an example. The bottom panel of the left hand plot below shows the 3.0 model for 365 gas consumption data points that are color coded by season. The model is restricted to a single balance point temperature and linear regions, which causes winter (blue triangles) usage to be mostly underpredicted and summer (red diamonds) and shoulder (green circles) usage to be mostly overpredicted. The cumulative error by season is captured in the same colors in the top panel and the divergence away from zero illustrates these effects.
The right hand plot shows the same data modeled with version 4.0. Now the winter season is treated separately while the summer and shoulder seasons are kept together. The cumulative error profiles are now much closer to zero – a massive improvement over the 3.0 model.
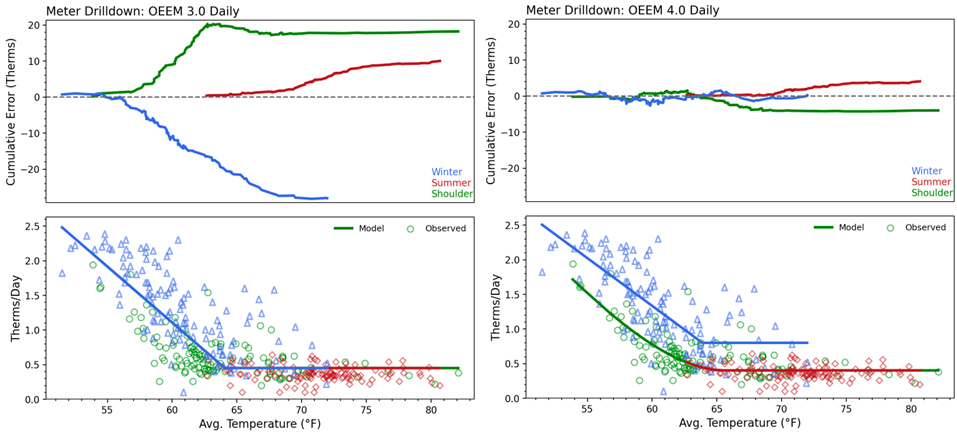
Figure: An example of the OpenEEmeter 3.0 model (left) compared to the 4.0 model (right). The bottom panels show the data points and baseline models (solid lines). Seasons are color coded (winter= blue triangles, summer = red diamonds, shoulder = green circles). The top panels show the cumulative error profiles by season.
In these figures we can also see that the 4.0 model is no longer restricted to purely linear behavior. Instead, the transition between regions can be curved in order to better match a building’s consumption patterns, which often include more gradual onsets of heating and cooling as weather changes.
Weekend/Weekday Bias
The OpenEEmeter 3.0 daily methods also do not differentiate between weekdays and weekends. However, weekday and weekend consumption patterns can be systematically different, especially within the commercial sector where many businesses are open during the weekdays and closed on weekends.
The plot below compares the distributions of fractional weekend bias among 1,000 commercial meters measured with the 3.0 methods (top) and the 4.0 methods (bottom). Without the ability to treat weekends and weekdays separately, the 3.0 results exhibit a long positive tail, while the 4.0 model eliminates this issue.
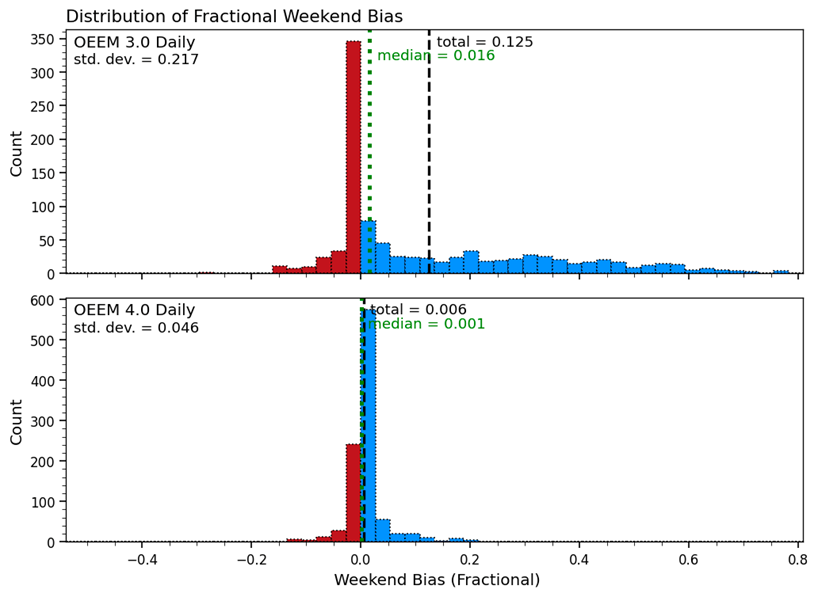
Figure: The distribution of winter bias in a sample of residential gas meters measured using OpenEEmeter 3.0 daily model (top) and the 4.0 daily model (bottom). Weekend bias improves from 12.5% to 0.6% in the 4.0 version.
Model Splitting
In OpenEEmeter 4.0, the decisions of when and how to split by season and/or day types and whether and to what degree to include curvature are made by the model based on the degree to which distinct usage patterns exist between these different time periods. The details of this procedure are provided in the model specification, but the basics are core to the improvements over 3.0 and are worth mentioning here.
The 4.0 model includes a “penalization function” that serves as an impediment to superfluous splitting. This function has been optimized through extensive testing and is designed to strike a balance between the flexibility to better fit data gained through additional parameters versus overfitting the model (making it less predictive). Without this penalization function, the model would always split in every way possible (separate models for weekends and weekdays for all seasons), introducing far more parameters than could be justified given just 365 data points.
Computational cost and efficiency
Despite the added functionality, OpenEEmeter 4.0 also operates much faster and uses far fewer computational resources than 3.0. The 4.0 model retires an incumbent exhaustive grid search, which steps through hundreds of distinct model candidates to find the specific set of balance point temperatures and slopes to best fit the data. In place, a global optimization scheme is used, along with other machine learning regression techniques that downweight coefficients whose presence does not improve model fit.
Overall, depending on the specific use case, the 4.0 model will run between 2 – 300 times faster.
We are excited to release this advancement to OpenEEmeter, which will improve the measurements that many initiatives now depend on to gauge the energy, cost, and carbon impacts of the programs and projects we all care so much about.
Additional Advancements
The OpenEEmeter 4.0 release also includes several key updates to libraries and tools provided by WattCarbon. We also are excited to announce that EEweather (the open source weather library used by OpenEEmeter) now includes support for UK weather data feeds thanks to the hard work of collaborators at Carbon Co-op. It’s wonderful to see contributions from several organizations to expand the reach and functionality of these open source tools.
Thanks to the LF Energy and Working Group Members
Recurve wants to thank all the members of the LF Energy working group who advised, debated, and contributed ideas throughout the development of OpenEEmeter 4.0. We’d like to specifically acknowledge Travis Sikes (lead developer of 4.0), Armin Aligholian (methods research), Jason Chulock (lead engineer of 4.0), and Joydeep Nag (code documentation and testing) who have all had a major hand in the methods and code development. Ethan Goldman has been a consistent voice of ideas and insights. Steve Suffian of WattCarbon provided important contributions to the OpenEEmeter 4.0. Matt Fawcett and James Fenna of Carbon Co-op led the thorough research and updates to expand the reach of EEweather. Adam Scheer of Recurve led the working group and served as chief armchair scientist.