
FlexMeasures v0.13 Now Available, Featuring Overlay Charts
Version v0.13 of FlexMeasures lets us create dashboards with multiple graphs from various sensors layered in one plot. In addition, FlexMeasures now includes a proper page for accounts.
On the backend, we protect the CPU from re-computing the same schedule over and over again if a rogue client asks for that.
See changelog for a complete list or read on below about the larger new features we added.
OVERLAY CHARTS
With FlexMeasures, you can adapt the dashboard shown on the page for any asset. By default, you see a plot per sensor. With the sensors_to_show attribute, it was already possible to remove and even add plots (e.g. public price data), to create the dashboard with maximum information value.
We wanted to make the dashboards more informative, as often users want to study effects of one sensor’s data on others.
Now, sensor numbers in sensors_to_show can be layered, e.g. [1, [3,6]] will lead to two plots, where the second shows two sensors together.
As a bonus, plots are distinguished by source (different trace), sensor (different color) and source type (different stroke dash).
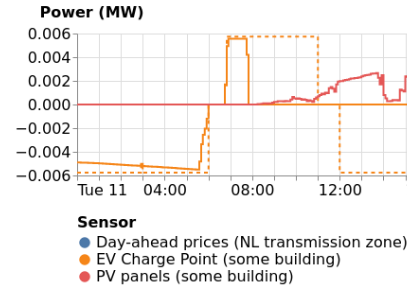
Here is an example (see the overlay of EV charging and PV supply in the lower graph):

A layered chart from Seita’s V2G living lab
This work was done in Pull Request 534.
ACCOUNT PAGE
FlexMeasures is not just a single-purpose program ― it’s a platform which can sit in the cloud and serve multiple sites. To manage these sites when they have different asset owners, the concept of accounts matters a lot. An account might for instance be a SME, with several local energy assets and also several employees (who might or might not have a FlexMeasures user account)
That’s why we worked on showing accounts better in the UI and API (in the CLI they are already represented well). The endpoints /accounts (to list accounts) and /accounts/<id> (to show one account) both work in the UI and (via /api/v3_0/) in the API.
We tried to make this useful both for users (looking at their own account) and admins (looking at all accounts). In the future, we hope to work on “consulting accounts”, who have the right to administer several other accounts (their clients), making FlexMeasures a potential B2B2B platform!
This work was done in Pull Request 605.
AVOID RE-COMPUTING THE SAME SCHEDULE
Computing schedules is where FlexMeasures creates its value, and also where it does the heavier CPU work. The more different sites we serve, the more we learn that it’s crucial to protect this CPU work.
Triggering schedules is easy, computing them is hard.
Here is an example scenario: A rogue client might trigger the same schedule multiple times ― a simple error, but overloading our server with work. In this feature, we enable FlexMeasures to notice that the same computation is already done or currently ongoing. This means not starting the computation again, and also informing the caller with the right status.
Technically, we now cache the job, so that before FlexMeasures creates a new one, it can look up if the equivalent already exists somewhere in the queue. Interesting architectural work!
This work was done in Pull Request 616.
API SUNSETTING
Finally, as our long journey to a more flexible datamodel is coming close to completion, we are sunsetting (as we pre-announced in version 0.12) API versions below 3. Please help your users upgrade to API version 3 before you use FlexMeasures v0.13!
We compiled some helpful information for FlexMeasures hosts to manage this transition well.
This work was done in Pull Request 650.
This article was originally posted at FlexMeasures.