FlexMeasures v0.24 Now Available, with More Expressive Congestion Modeling
This article was originally posted at FlexMeasures

Version v0.24 of FlexMeasures adds more expressive power for behind-the-meter scheduling constraints, and it also lets you design your graph dashboard. And we completed pagination in the UI.
This was actually a larger release (~70 PRs, three new committers). See the changelog for a complete list.
Let’s dive in!
Combine economic modelling options (e.g. peak costs & prices)
Behind-the-meter orchestration can become a complex problem, with multiple optimization goals potentially competing. So far, FlexMeasures could model hard constraints (e.g. consumption limit) and an optimization signal, usually a price per kWh. Both of these examples are penalties or rewards for energy commitments, that influence in distinct ways how the FlexMeasures scheduler will optimize the aggregated energy profile of the site.
But behind the meter, there are more intricate constraints, penalties and rewards, as different parties (e.g. the DSO, the day ahead market operator and the local business) have different ideas about how energy should be used. Especially the modeling of the congestion problem inspired us to extend how FlexMeasures can model the different needs.
With 0.24, any number of commitments which have their own reward or penalties can be modeled in the same optimization, and the scheduler will try to get the best overall profile.
This is a big step towards capturing more goals of behind-the-meter orchestration. It was not trivial to model this extension. From here on, FlexMeasures has much more expressive power!
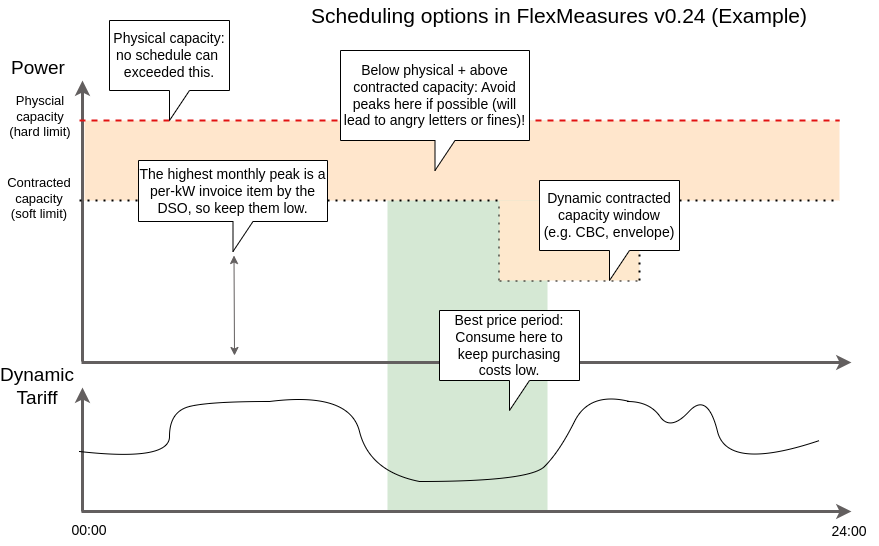
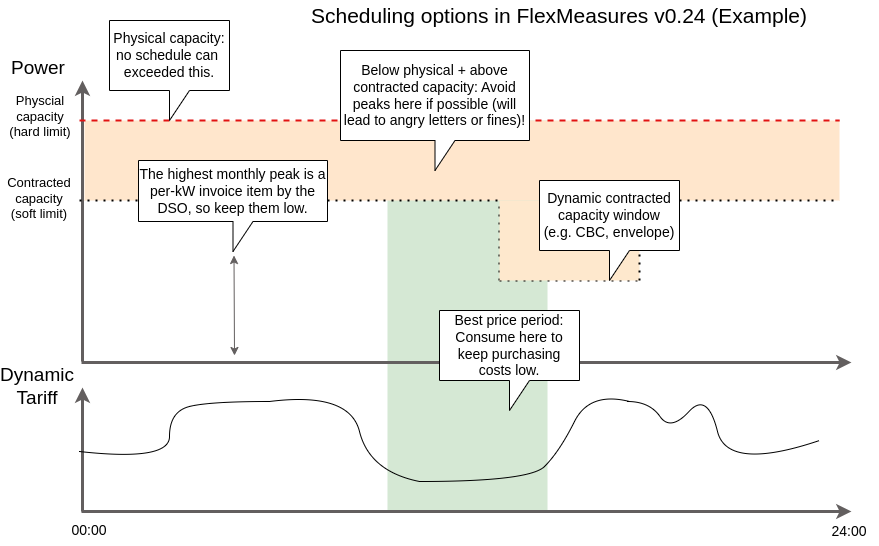
Here is an example, which is inspired from a situation with a highly congested grid (as we experience in The Netherlands). Note that in the main PR you find a test which models this example, as well). Suppose that within the same optimization of schedules, we want to:
- use a day-ahead tariff for pricing our energy purchasing -> buy low, sell high
- model the DSO costs, as well (the DSO’s monthly invoice depends on the highest peak) -> modulate how high peaks get within the contracted capacity
- allow breaching the contracted consumption capacity, but incentivize the scheduler (with a penalty) to attempt avoiding this as much as possible

That last point seems counter-intuitive (allow breaching contracted capacity, but penalize it), but during simulations with different battery sizes, we found it invaluable that the contractual limits are not hard constraints, so we still get the best schedules, even on days where the battery cannot on its own keep the consumption within limits. Note that the physical limits can also be added, and should be hard constraints.
The scheduler will take all these goals into consideration, using existing and new flex-context fields like site-peak-consumption-price, site-peak-consumption-breachand site-peak-consumption-price (check the documentation for details).
Note that after the fact, the actual reporting of costs can represent what will actually be invoiced, e.g. energy purchasing (dynamic tariff) and peak costs by the DSO, but not the penalty used to avoid peak breaches.
This work was done in Pull Requests 1144 and 1254.
Editing your own graph dashboard in the UI
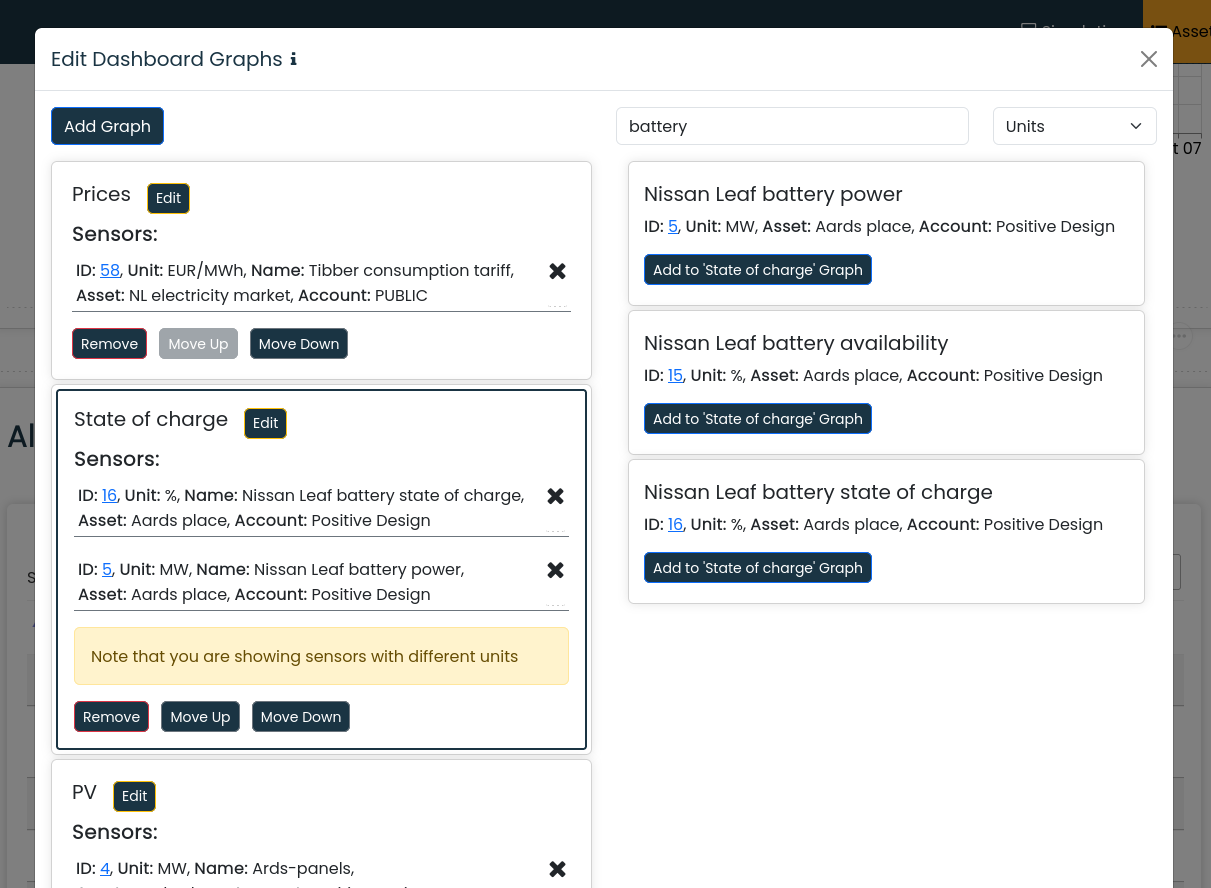
The asset page is where FlexMeasures shows you data (measurements, schedules, etc) in graphs. As your use cases and sites differ, your needs for this graph dashboard will differ. Previously, it was possible to configure different graphs and plots, but it required editing a JSON field. As of version 0.24, you can edit what you want to see right in the UI:

This work was done in Pull Requests 1212, 1145 and 1152.
More pagination in UI for faster browsing
When a lot of data is being shown, FlexMeasures’ pages could get slow. In v0.23, we already started adding pagination parameters to API endpoints for assets and users. This now includes also accounts and audit logs, and we finished our work on all FlexMeasures UI pages, so that they now only load small batches of entries at a time.
This work was done in Pull Requests 1115, 1116, 1143, 1201, 1274 and 1282.