FlexMeasures v0.21: Service Better with Status Page and Audit Log
This article was originally posted at FlexMeasures.
Version v0.21 of FlexMeasures adds business value which comes through happy customers. Why does this matter? An app which deals with real-time complexities like energy optimization needs to an excellent help desk ― next to getting optimal scheduling right, it’s crucial to find out quickly why something is not going according to expectations.
Imagine the customer on the phone with your service or technical staff. How to start investigating where it went wrong?
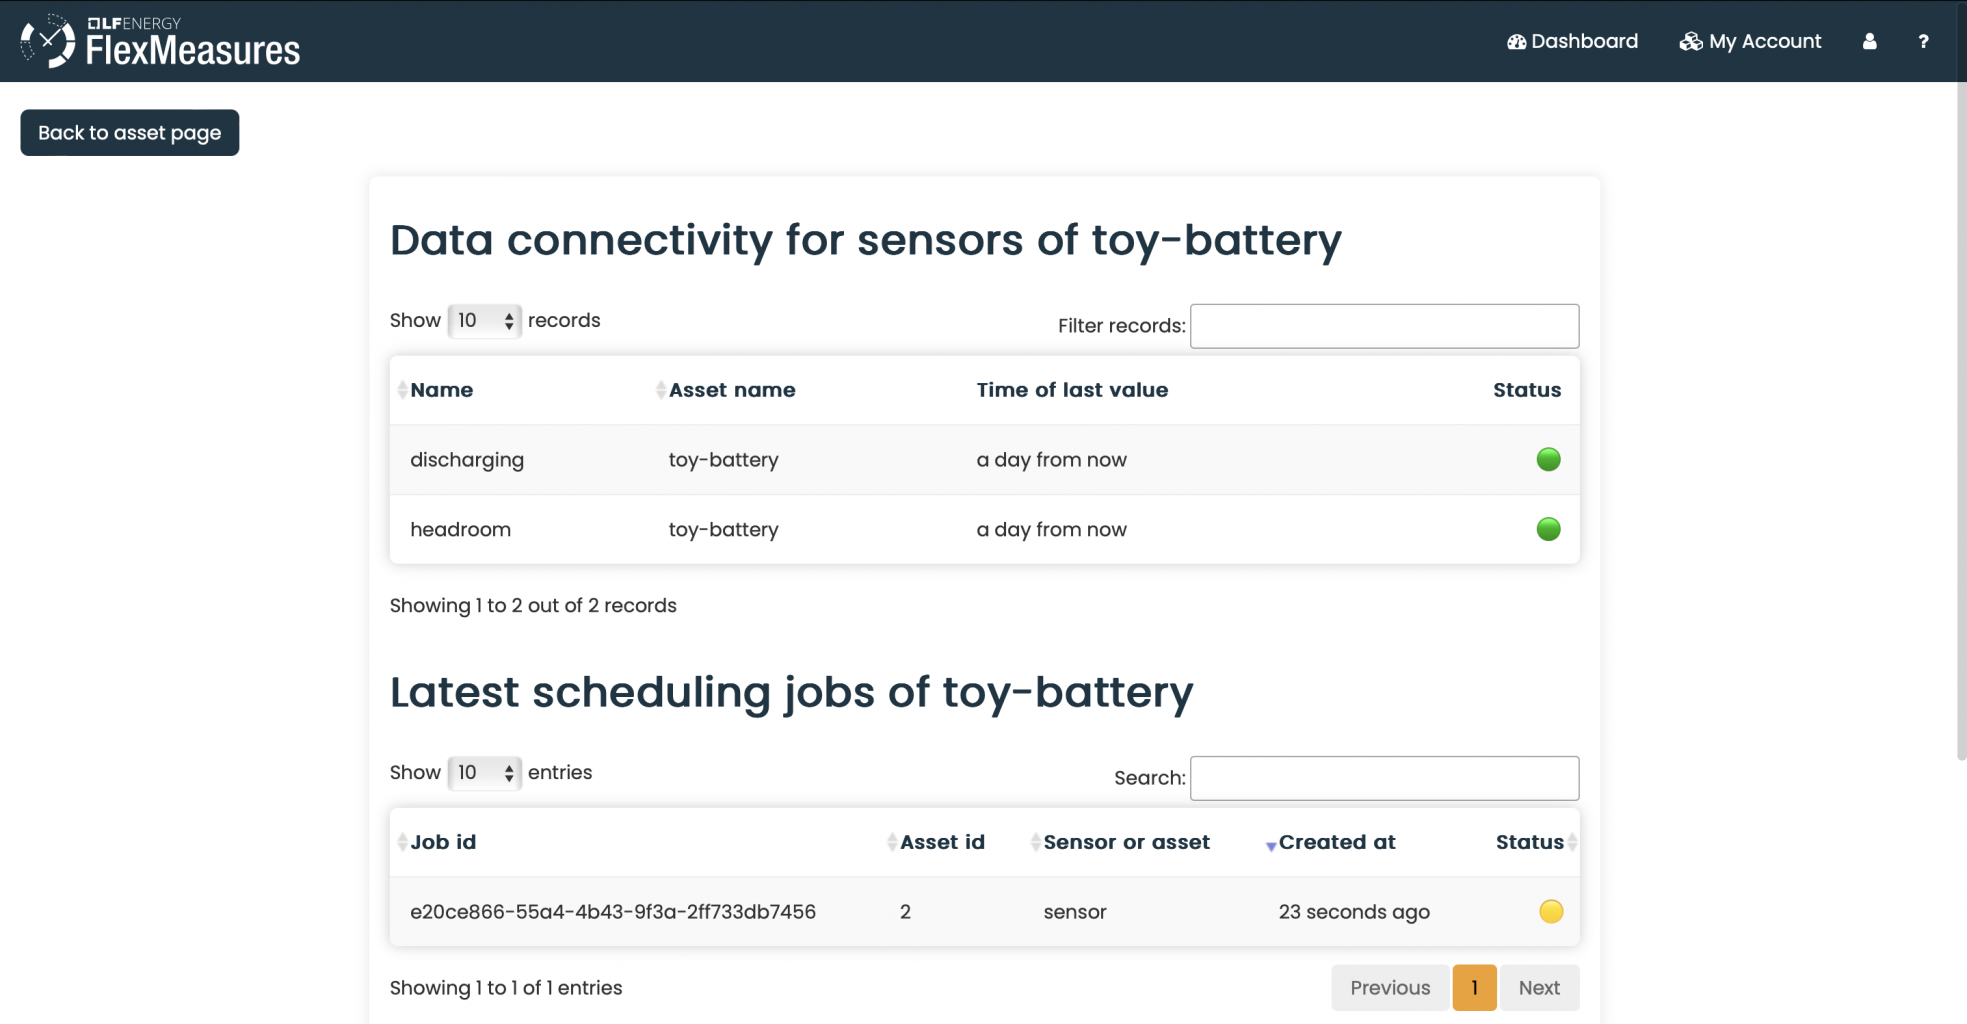
To help with this situation, version v0.21 of FlexMeasures brings two major features that can help you provide better support for your customers ― a status page for assets and an audit log for accounts & users.
Other than that, there are some smaller improvements, notably to link to specific date ranges on the asset page. See the changelog for a complete list (link will work on May 16, day of release).
STATUS PAGE
A site which is being optimized with FlexMeasures usually has a few assets (some flexible, some not) from which recent data is required. This data sometimes comes from different sources, e.g. sent through the API by the monitoring partner, and gotten through a third-party API. We need to be able to see if all of this data is coming in correctly. If not, scheduling will probably fail due to missing data.
We created a status page which lets you see if the necessary data connectivity is given. Also, we show the recent forecasting jobs and whether they succeeded or failed.

We are still improving the status page. It will become faster in the next version, and we might add even more information.
AUDIT LOG
Next to the raw data and scheduling, an important part of the user experience are accounts. Has a user been created correctly, or set to being inactive, or has a password been rest? And who did that?
Answering such questions can be an important building block in providing good service without big hassle.

We will also soon extend the audit log for other important events, like important changes on the asset attributes (which would also influence how scheduling goes) or additions of new assets.
You can of course also make use of the audit log in your own plugin logic. Put in here what is important to you and your help desk.
See Pull Request 1042.
LINKING TO A CUSTOM TIME RANGE OF DATA
It is also useful to point someone to a specific point in the data. “This specific Saturday shows scheduling behavior that seems off to me”.
We now support linking to the asset page (where a dashboard shows data) with the date range contained in the URL. The date range picker adds start and end date to the URL. You can also click a link symbol beneath the dashboard to copy the URL to your clipboard.